Bike Counts

Traffic and bike counts are essential to transportation planning and infrastructure development in the capital region. We run two count programs, automated and volunteer, to collect data on bike and pedestrian traffic.

Visit the Regional Transportation page to find out more about our transportation plans and active transportation initiatives.

Automated Counts

We have set up automated bike and pedestrian counters around the region to track annual and seasonal trends. These counters use specialized sensors to differentiate between bikes and other users, and also record the direction of travel. The counters provide real-time data that updates daily.

We work with partners like the City of Victoria, the District of Saanich, City of Colwood, Township of Esquimalt and the University of Victoria to offer a single access point for all automated counts in the region.

Volunteer Counts

Since 2011, we have been counting bike volumes with the help of volunteers. We use a method recommended by the Institute of Transportation Engineers.

Our volunteers count bikes twice a year, in May and in October. We do all the counting in one day, usually on a Tuesday, Wednesday or Thursday. Be careful when comparing year-over-year changes because these are short counts and factors like the weather can affect the numbers. Comparing counts at different stations during the same period can help reduce these differences.
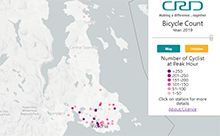
crdbikecounts

Count Results Maps

As of 2019, count results are shown on an interactive map at:

Zoom in and click on the count station icon to get more information.

Archive 2012 to 2018

 October 2018

May 2018

October 2017

May 2017

Note: As of May 2017 counts are no longer intersection totals. They now reflect bidirectional travel on one street/trail segment. Bikeway infrastructure on these maps is current as of January 1, 2017. Increased volumes on Pandora Street are likely the result of the bidirectional protected bike lanes opened in May 2017.

October 2016

May 2016

October 2015

May 2015

October 2014

October 2013

July 2013

May 2013

January 2013

The first of the four-season counts ran from January 8 - 10, 2013. A total of 20 stations were counted, including three that were counted during the midday (9am to 3pm) and on all three count days. In addition to the maps, fact sheets (below) were developed to analyze volume change from October 2012 to January 2013, volume comparison throughout the day and gender breakdown (which was also new in 2013).

Fact Sheets

Maps

2012 Count Results

The counts were mapped and reported to the Planning Transportation & Protective Services Committee (PT&PSC ) meeting November 28, 2012.

The 2012 count ran October 2 - 4 at 60 locations.

Bike Count Volunteers

Bicycle counters are valued members of the data collection team. If you are interested in volunteering, please send us an email.